
2019 Market Update in Review: A Banner Year & 2020 Market Outlook: Positive But Volatile
2019 Market Year in Review: A Banner Year


Economic growth and corporate earnings slow-down, a trade fight between U.S. and China, a U.S. president under impeachment proceedings, and more could not shake the market’s upward trajectory in 2019. Just 12 months ago we were reeling from a December correction that saw the S&P 500 down more than 9.0% in one month and more talk of recession than bull markets. Yet, by the time the ball dropped in Time Square a few days ago, we finished the year strong, up double-digits, and few see the positive market moves ending soon.
Let’s take a quick walk down memory lane for 2019. The S&P 500 produced its best one-year gain since 2013 rising 31.5% when including dividends. Returns by sector were all up double-digits, but there was some disparity between sectors as seen in the table below.

Technology was the clear winner while health care and commodity-related industries ranked towards the bottom. Health care sector performance usually correlates well with growth, risk-on market conditions, but it “underperformed” with a 20.8% return in 2019. This was due to campaign discussions especially in the Sanders/Warren platforms. The concept of creating government health care for all which would drastically reduce the profitability of major segments like pharmaceuticals and medical devices. It is hard to imagine a big rebound in health care stocks in an election year where both the White House and the Senate could change political parties.
Bonds also had a good year with a total return of 8.7% as bond yields fell and prices rose, providing the lion share of the return. This combination of both a strong stock and bond market is special and in only four other calendar years in history has it been better (1985, 1987, 1995, 1997). Helping propel U.S. markets were unemployment near 50-year lows, low and steady inflation, a dovish Federal Reserve, and upward revisions to GDP.
Similarly, international equity markets benefited from low inflation and central bank easing. Negative interest rates in most of the European Union boosted asset value and additional fiscal stimulus created asset demand in a stubbornly slow European recovery. Additionally, we got two key policy positives at the end of the year with a planned U.K. exit from the EU and Phase 1 of a trade deal between the U.S. and China which impacted worldwide markets.
Sandy Cove’s Repositioning into Year End
In a year like 2019 where all asset classes had strong performance, our rebalancing was more a function of trimming areas where superb growth increased the exposure to that asset class. The Sandy Cove model portfolio with a 70% equity / 30% fixed income allocation returned over 19.0% in 2019 compared to our longer-term return assumptions for a 70%/30% allocation of 6.4% per year!
Rebalancing is key to ensure your asset allocation will help meet your financial goals today and in the future. It is a tool we employ to help us take the appropriate amount of risk to gain growth (the reward). When stocks dip and the equity percentage allocation is reduced, it’s time to rebalance toward equities. This is often the hardest thing for the average investor to do because buying when prices are attractive is also when fear and unknowns are at highs. History has shown however, that rebalancing has added value overtime. On the flipside, like 2019, when equity asset classes outperform bonds over a time period, the allocation tips higher to equities and must be rebalanced (selling equities and buying bonds) to keep in line with the stated allocation. If one stayed on course and did nothing to the portfolio, he/she would be adding risk beyond the expected tolerance range and potentially creating a portfolio that would not meet its goals. This type of rebalancing usually incurs capital gains as one is selling the growth asset class (equities).
Throughout 2019 we employed a disciplined rebalancing process for our clients, mostly reducing equities as that growth asset class had well-above average returns. We took action where needed and made some of the following rebalancing moves based on clients’ asset allocations, risk tolerances, and what we thought were attractive profit-taking opportunities. With profit taking comes taxes and while most of us are tax averse, it’s an outcome of growth and therefore a good problem to have.
In general, we made the following rebalancing moves during 2019:
- From Equities to Fixed Income assets
- From Growth Equities to Balanced Style equities
- From Tech-Focused Equities to Diversified Equities
- From Short Duration Bonds to Intermediate Term Bonds
Sandy Cove Advisor’s 2020 Market Outlook: Positive, but Volatile

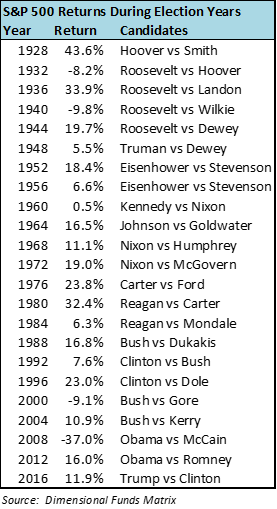
Notable market strategists have offered up their macro views of where the S&P 500 will end in 2020 providing a glimpse of their firms’ thinking. Most are assuming the S&P 500 year-end level between 3,300-3,500, which means a year-over-year growth rate of 2.0%-8.0%. We think equity returns could be at the mid-point versus the high-end of the range. We have further to fall as valuations, while not extreme, are certainly elevated in the U.S. Currently, the S&P 500 forward price-to-earnings (P/E) ratio is 18.2x versus a 25-year historical average of 16.3x and a 25-year range of (10.0x-24.0x). Additionally, the record high values we find most indices at today are not attributed to strong underlying earnings growth of corporations last year, but from P/E multiple expansion which can contract as quickly as sentiment can change. However, we also think there could be more upside to the low-end of the range where strategists assume volatility due to the enormity of what U.S. elections could mean for public policy. We look to history for a bit of guidance here, and the performance of past presidential election years are more positive than you may suspect. The table below outlines each election year return of the S&P 500 from 1928 to the last year available, 2016. The average of all these years is a positive 11.3% return for the S&P 500.
Another way to view performance which we think is healthier is in a longer time period. While many define markets in specific 1-year periods that start January 1st and end December 31st, it is probably best to take a two-year view and average the 2019 stellar year with an expected low return year in 2020. A two-year average return would still be quite healthy in both stock and bond markets.
Speaking of bonds, after an unusually strong year in the bond market due to price appreciation, we think we are on target for a very modest return in 2020. Given the low inflation and low growth, we see no change to the central banks’ accommodative policies. With 10-year rates in the U.S. around 1.8% and European rates mostly negative, we see little rate decline this year which means very little price appreciation.
Let’s see what the first year in a new decade has to offer by examining three key areas we think the market will take direction from in 2020: the economy, U.S. elections, and corporate earnings growth and quality.
Economic Picture
Economists surveyed by the Wall Street Journal expect the U.S. economy to grow 1.8% in 2020, which would be a slowdown from prior years’ 2.0% growth range. However, this growth would add to the continuation of the longest economic expansion in U.S. history. Slow growth does not equal recession or negative growth, and can still be an environment where markets accelerate. As recent history showed, during 2019 U.S. equities grew over 30% during an expected 2.0% GDP growth year.
Leading economic indicators, which tell us how the U.S. economy is likely to do in the future, are still positive, but weakening, which explains the slower growth projections. While the service sector and the consumer are on solid footing, all the uncertainty around U.S.-China tariffs has definitely affected business sentiment, long-term capital spending/investment, and thus the industrial/manufacturing sector. All in, the latest indicators do not suggest an economic downturn in the future, but a continued muted growth profile across the globe (see economic indicator chart below). In addition, there is a strong correlation between OECD economic indicators and performance of worldwide indices like the MSCI AWCI (All Country World Index).
OEDC’s Leading Economic Indicators (amplitude adjusted, 8/30/14-8/30/19)

Source: Natixis PRCG, FactSet
The International Monetary Fund (IMF) publishes their global growth forecast two times a year and the latest figures from their October report forecast 3.4% global growth for 2020 which is an uptick from their 2019 forecast of 3.0% world-wide. While an improvement thanks to accelerating economies in Brazil, Mexico, Russia, Saudi Arabia and Turkey, the IMF notes these figures are below world-wide average growth. The IMF places a fair amount of blame for weakness in manufacturing activity and global trade as a result of the prolonged U.S.-China trade dispute.
On the upside, interest rates and inflation are even more subdued internationally than the U.S., with most of Europe’s short-term government bonds returning negative yields. There is more fiscal stimulus in Europe than the U.S., which should provide a tailwind to that economic region in 2020. We are beginning to see equity flows into Europe after 2+ years of outflows.
Inflation is still below central bank targets of 2.0% globally with the U.S. at 1.8% Core PCE, the Eurozone at 1.3%, and Japan Core CPI at 0.5%.
Inflation: No need to worry here (11/30/09-9/30/19)

Source: Natixis PRCG, FactSet
U.S. Election Year:
Political uncertainty is likely to contribute to policy uncertainty which in turn contributes to delayed investment/infrastructure spending by world-wide corporations. We can already see evidence of this in decreased global manufacturing and fixed investment spending in 2019. We do not believe we’ll see material changes until after U.S. elections. We believe markets will take more stock in election rhetoric and early primaries and we want to keep our clients fully diversified to weather what divergent political choices will be made.
Democratic front runners according to the January 3, 2020 national polling by the New York Times has the following candidates in the lead:
Joe Biden 27%
Bernie Sanders 19%
Elizabeth Warren 16%
Pete Buttigieg 9%
PredictIt® shows Biden and Sanders gaining ground and leading over the last 90 days, Warren and Buttigieg losing ground over the last 90 days, and Bloomberg and Yang holding ground at the rear. Candidate popularity in the polls will certainly weigh on market performance given the various policy stances being discussed.
Candidate Elizabeth Warren, for example, has declared her position on taxes as follows:
- Repeal Tax Cuts & Jobs Act that Trump put into place
- Increase capital gains tax (now at 15-20% rate) to ordinary income rates (10-37%)
- Require Americans to pay capital gains annually, not just when investments are sold
Clearly, markets would not be at current levels if these policies were put into place. Bottom line, it is still anyone’s race and the early Iowa and New Hampshire primaries in February will just be the start of whittling down the 14 candidates still in the race.
Another important factor in 2020 elections are the Senate seats up for re-election. Currently, the 100 seat Senate stands at 47 Democratic and 53 Republican. Democrats have 12 seats up for re-election in 2020 while Republicans have 23 seats. Of the 23 R-seats, 13 are deemed solidly Republican, six seats are likely Republican, but four seats (NC, AZ, CO, ME) are toss-ups and could swing the Senate to a Democratic majority. This may be more impactful if the White House also goes Democratic.
Corporate Earnings Growth & Quality
We come to our last key driver to market direction in 2020: corporate earnings. Looking at earnings growth for 2020, it’s important to note that year-over-year comparisons are easy since growth was barely positive in 2019 so each quarter has a very low bar to meet to provide positive growth. As seen in the table below, the S&P 500 is expected to have accelerating growth each quarter of the year with full year expected growth of +10.0%.

Additionally, it is worth noting the composition of this growth is not all financial engineering (stock repurchase). Most strategists are eyeing about 5% revenue growth overall, some modest operating margin expansion and then 3-4% earnings per share (EPS) growth to get to that 10% figure. Around the rest of the world, earnings growth is expected to be a healthy 7% according to Natixis PRCG. Despite lower expectations of EPS growth around the world, their markets’ valuations and cash flows are much more attractive. Forward price-to-earnings ratios in non-U.S. countries (MSCI ACWI ex. U.S.) are 22% lower than the U.S. at about 14.2x versus 18.2x in America and dividend ratios around the globe are 70% higher than in the U.S. (S&P 500 dividend yield currently at 1.9%).
What could prove our forecast wrong? There are certainly factors that could affect and/or change our market assumptions for 2020. We’d note the following potential obstacles to our market assumptions and potential catalysts that would prove our assumptions too conservative:

As always, your Sandy Cove team is available to answer any questions about the markets or your portfolio. We wish you all a Happy New Year and a healthy and prosperous new decade.
Read more from this month's "Perspectives"
![]()
![]()
![]()