
Second Quarter Market Update: Markets Stage a Rebound
Click here for a printable version


SECOND QUARTER EQUITY MARKETS
U.S. Markets
In general, markets continued to gain strength in the second quarter after the first quarter bounce back. We finished the first half of the year in a much better state than most had anticipated. Leading the quarterly index performance once again, was the S&P 500 Index. The S&P 500 is back above 4,400 levels and 8.0% away from its all-time high as of June 30th.
Through the first half of the year, the total return of the S&P 500 was a stunning 16.9%, followed closely by midcap U.S. stocks with a 16.7% total return. Emerging markets and REITs were at the bottom of the rankings, but still had positive returns of 4.9% and 3.0%, respectively.
We expected volatility in the markets at the beginning of this year, and markets did not deliver as much as we thought. We saw the S&P 500 rise in the early part of the year, only to have all the gains erased when two regional banks collapsed near the end of the first quarter. However, benign inflation readings, strong jobs reports, AI-related investing, and a pause in rate hikes at the last Fed meeting were all likely reasons that equities posted a strong second quarter. The facts above could have also been the reason why volatility was stamped out the last three months of the year. As the CBOE Volatility Index shows below, there is a material decline in volatility from the bank crisis in mid-March through quarter end.

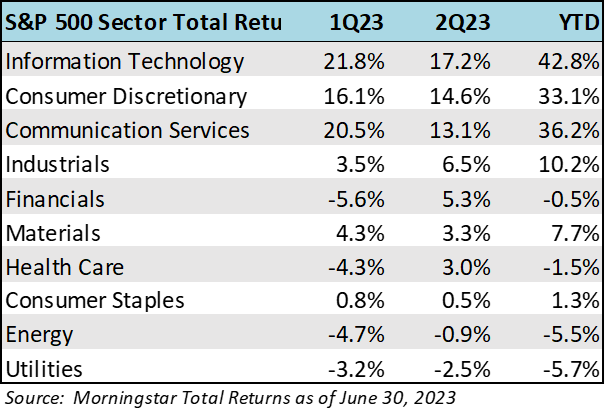
From a sector perspective, technology stocks that fell the most in 2022 were up the most in the first half, and by a staggering amount! The information technology sector rose nearly 43%, in the first six months of 2023. Strong first half gains by NVIDIA (+189%), Facebook/Meta (148%) and Tesla (+118%) to name a few, were the reason for the surge in this sector. Returns were much more muted in the healthcare, materials, and consumer staples areas of the economy. Laggards year-to-date included energy and utilities.
Narrow Market
We noticed in the January to May time period that the S&P was rising nicely, but a closer look into the index showed that is was it was mainly due to only a few stocks. The lack of breadth is apparent in the chart below, which shows performance through June 6th. As you can see the top eight performing stocks of the S&P 500, accounted for nearly the entire return of 10%+ of the 500 stock index as of 6/6/23. That means that the remaining 482 stocks in the index were basically flat for the year-to-date.

We are hopeful that the breadth we began to see at the end of June across different sectors and asset class sizes will continue to gain favor. June saw a rotation into small cap U.S. equities and the index broke above its 200-day moving average. Indeed, the U.S. small cap index had the highest return in June, up 8.1%, beating out the S&P 500 for the first time this year. Time will tell if the market continues to widen, but it is something we are watching closely because breadth tends to confirm a broader market move (up or down).
International Equities
Returns “across the pond” were stronger than the U.S. in the first quarter, but that reversed course in the second quarter with the S&P’s 8.7% return in 2Q23 beating out the MSCI EAFE Index return of 3.0%. News that one of the largest economies in Europe, Germany, was in a recession in the later part of last year did not help matters. Another surprisingly strong inflation report in the U.K. was also hurting market sentiment and allowed central banks to continue with their hawkish stance. The European Central Bank (ECB) raised rates another 0.25% to 3.50% and economists expect additional hikes in the coming months to bring the rate near 4.00% in the region. Europe has still not seen a peak in core inflation, but that would be a catalyst for improved equity returns when it happens.
Lastly, China’s post-reopening recovery lost a bit of momentum and expectations have become more muted causing analysts to lower European industrial export growth rates.
The good news is that the latest OECD report (see below) on economic activity by country/region is not forecasting a recession for any country except Russian and Argentina.

FIRST HALF BOND MARKETS
Returns continued to be positive for fixed income after a terrible 2022. As a reminder, the 2022 bear market in fixed income was the worst seen since the Barclays Aggregate Index was created. The Barclays Aggregate Index had positive performance 42 of the last 47 years and 4 of the 5 negative years were single digit declines versus the -13% decline in 2022. We are happy to have turned the page away from 2022 and so far 2023 is going about as expected. The saying “there is finally INCOME in fixed income” was heralded by many bond managers as positive and rising yields returned to this space on the heels of the Fed’s 15+ month interest rate tightening cycle.
The bellwhether Barclays U.S. Aggregate Bond Index rose 2.1% in the first half of 2022 while the corporate investment grade bonds rose 3.2% and the riskier high-yield benchmark rose 5.4%. These represent typical returns for fixed income. Given that we think the Fed is close to ending rate hikes, there should be very little downward price pressure (bond prices fall when rates rise). In the next 6 to 12 months, we could see the Fed begin to lower rates, which would cause bond prices to rise in value, also a benefit to bond holders.
Despite rates rising, they are not doing so in unision across the yield curve. As you can see from the 6/30/23 blue line yield curve below, the curve is still inverted whereby, you are getting paid a better return (yield) to keep your dollars in short-term bond instruments than you are for longer-term ones. Typically, an investor will expect a higher return for a longer-dated bond because the money is being locked-up and there is an expected premium to be paid. The case today, with an inverted yield curve, signals that the bond market has a pessimistic outlook in the long-term (i.e. recession).

Municipal Bond Market
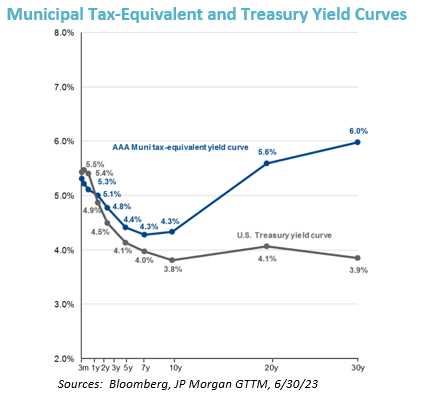
Municipal bonds continue to be attractive from both a credit fundamental and a yield standpoint. Tax-equivalent yields of municipal bonds (assuming the highest 37% tax bracket) continue to be better than government bonds. The chart below shows municipal bonds across various maturity dates versus government treasuries. Note the material pick-up in yield from municipals in the intermediate (5-10 year) areas.
FIRST HALF ECONOMIC PULSE
Despite Fed tightening, we are still seeing some resiliency in the economy.
- 1Q GDP was revised up to 2.0% from an initial 1.4%
- Monthly inflation rates have declined steadily
- Disposable personal savings is still rising
- Credit fundamentals in fixed income are still strong
- Labor market is still tight
However, we do note that yield curve has been inverted now for over a year (tends to forecase recessions) and the leading economic indicators, including manufacturing and orders point to an economic slowing down. Whether that slowdown becomes an outright recession or a soft landing remains to be seen.
EMPLOYMENT PICTURE
The jobs market showed signs of softening in the June report. Expectations were for 240K new jobs in June, but the actual figure came at 209K – a disappointment for many. Also, the strong May number (initially 339K) was revised lower to 306K. Unemployment stood at 3.6%, still historically low.

The job openings (JOLTS) report for May was released in early July and showed that new job openings fell. As the chart below illustrates, job openings have been falling since early 2022. Job openings decreased to 9.8 million in May, down nearly 500,000 jobs from April, and down 2.2 million jobs from the high mark of 12.0 million openings in March of 2022.

INFLATION
June Consumer Price Index (CPI) showed that inflation has slowed sharply. CPI was up 3.0% year-over-year and core CPI (ex food/energy) came in at 4.8% better than expected. Markets cheered the news as these readings mean the Fed can soon end rate hikes. Month-over-month CPI rose only 0.2%, much better than the 0.3% expected increase. As the CPI chart below shows, we have seen 12 months of consistent downward prints on CPI from the high of 9.1% in June 2022. Moreover, we are approaching what the Fed views as “normal” inflation rates in the 2.5% range.

Other important economic data points for the month are highlighted below:
PPI – June’s PPI inflation was 0.1%, below expectations of 0.4%. This marks the lowest PPI number since September 2020, signaling a sharp decline in inflation. Goods were unchanged after reaching 1.6% in May and services increased 0.2%.
PCE – The Fed's preferred inflation index, core PCE, was 4.6% in May, down from 4.7% in April.
Retail Sales – June’s retail sales grew 4.9% compared to a -1.0% decline in June 2022.
Consumer Confidence – rose to 109.7 in June compared to May’s 102.5.
US Leading Economic Indicators – the Conference Board LEI fell again by 0.7% in May to 106.7, after declining by0.6% in April. The LEI is down 4.3% over the six-month period between November 2022 and May 2023—a steeper rate of decline than its 3.8% contraction over the previous six months.
Housing Starts – unexpectedly jumped 21.7% in May seasonally adjusted versus a year ago to an annual rate of1.63M homes.
ON TO SECOND HALF OF 2023
We continue to be encouraged by the slowing inflation figures and a still resilient labor market (and consumer). We made these same observations at the end of the first quarter and they still apply to the second quarter. These two major economic datapoints are the main reason we are not in the camp on a steep recession anytime soon. Certainly a GDP slowdown is likely and well-telegraphed. However, our belief that equities would rebound in 2023 from the bear market in 2022 still stands and we are confident that staying in equities and putting new cash to work in equity markets (and municipal bonds) are the right moves this year.
Many, including us, were surprised at the strength of the technology rebound to-date. A large part of that outsized return year-to-date came from the excitement of artificial intelligence, as a new technology paradigm. With valuations in technology once again lofty, we would not be surprised to see a near-term pull back in the space. However, we are seeing early signs of market breadth outside of technology in June and July and think this would be a benefit to the overall equity markets in the second half.
The focus for us in the coming weeks will be the commentary from companies reporting quarterly results and providing forward guidance along with the Fed’s next meeting at the end of July.
We hope you are enjoying your summer and reading from Sandy Cove Advisor’s curated summer reading list!
If you would like to have further discussions with our team, or one-on-one, please do not hesitate to contact us.