
Second Quarter 2025: Markets Rebound from Tariff Uncertainty
Financial markets staged a rapid recovery from the tariff-led market correction in April. The S&P 500 low for the year occurred on April 8th when the index closed at 4,983, down 19% from its all-time high in early February. From that low to the end of the second quarter, the S&P staged a quick recovery, rising nearly 25%, on the heels of tariff delays and constructive economic reports.
As one client remarked, if you closed your eyes on January 1st and woke up mid-year, you would be happy with a 6.2% return of the S&P 500 and 4.0% return in bonds, so far in 2025!
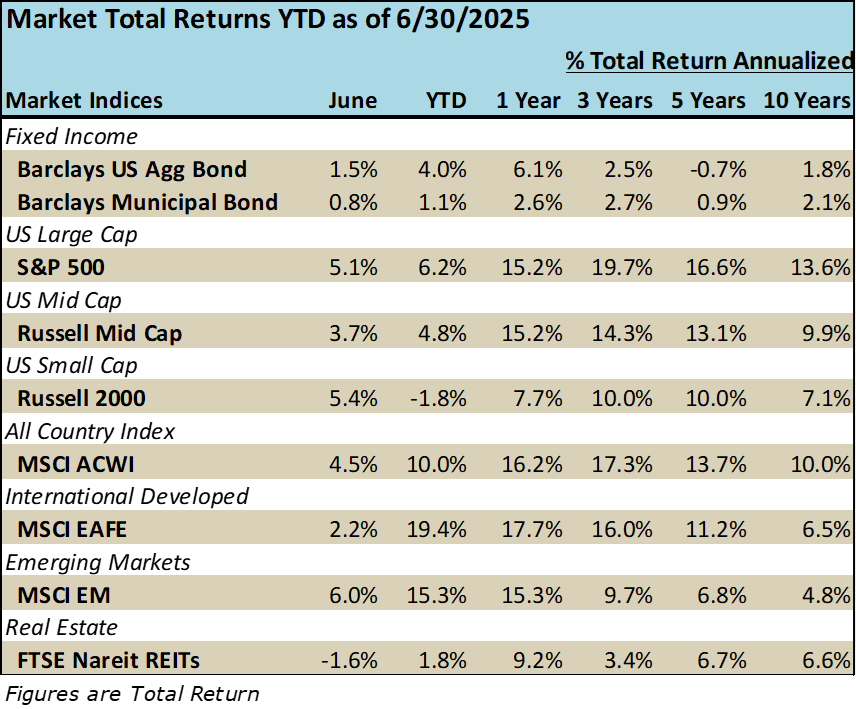
Non-U.S. equities continued to shine in the second quarter as noted by the 19.4% return for EAFE Index (international developed nations Europe/Australasia/Far East). This return is somewhat misleading as the local growth of stocks was 8.3%, but including the currency translation with a weaker dollar, the growth is 19.4% in U.S. dollar terms. Germany was a standout region as the country made a decisive move in its 2025 budget to invest $563 billion into the country’s infrastructure and military defense systems.
ECONOMIC DATA: Unfortunately, we see ourselves in a period of instability for the next few months with markets remaining highly reactive to both economic and policy news. While economic reports happen on specific dates, policy news has a more erratic cadence, which will keep volatility and uncertainty high.
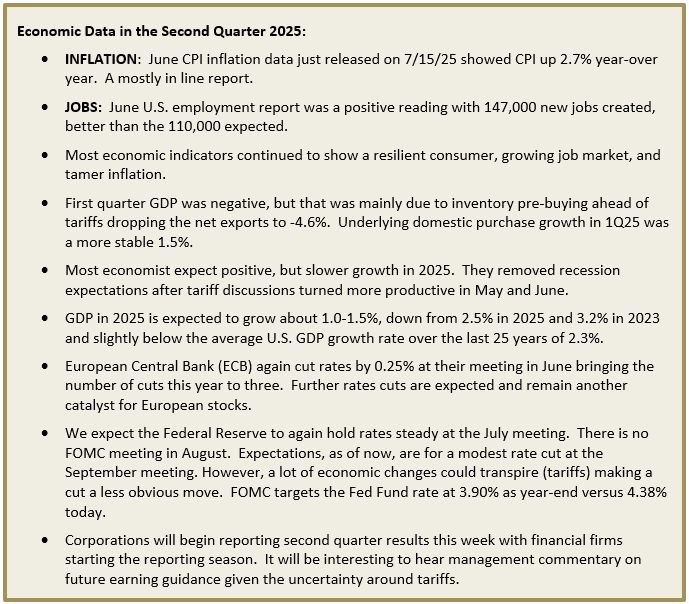
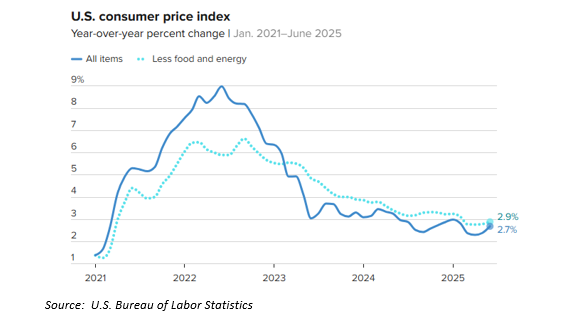
INFLATION: The latest read on inflation was in line with expectations. We are yet to see any meaningful price hikes working into the consumer level from tariffs. This is not to say that it could not happen later in the year (or into 2026), but so far the trajectory for inflation has been a steadily declining one from the highs in 2022, as the chart below displays.
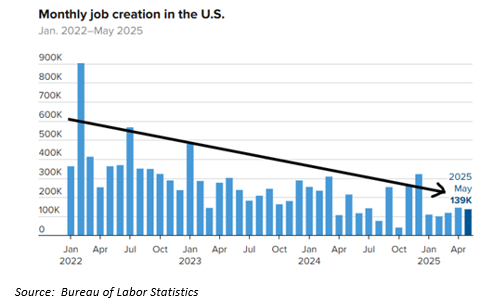
JOB GROWTH: We are seeing economic growth and that is also showing up in the job numbers. While still positive, new job creation is slowing down from 2023 and 2024 time periods when the average monthly add was 225,000 and 186,000 jobs, respectively. The June Jobs Report of 147,000 new jobs was the 54th consecutive positive monthly payroll report…the 2nd longest streak in U.S. job growth history.
CONCLUSION AND WHAT’S NEXT: We have been disciplined at staying in the market for our clients, even during times of short-term dislocation (April). We used the opportunity to buy low for clients that had excess cash. We noted in our first quarter review that difficult market corrections do not last forever and more likely than not, they create opportunities. This was certianly the case in 2025, and gains from the April lows through June provided solid returns in a very short period of time.
We continue to maintain our stance of having a larger exposure to U.S. equities than the world market index. This positioning has served our portfolios well over the past 10 years, while modestly detracting from portfolios in the first six months of 2025, as international stocks bested their U.S. counterparts (so far). We still believe the U.S. offers the most compelling long-term growth prospects. In our view, the ongoing Artifical Intelligence revolution, combined with the nation’s entrepreneurship and ingenuity will continue to provide higher returns over a long periods favoring this pro-U.S. investment approach, in our opinion.
This bring us to another interesting point of continuing to invest in a market that has already done well. It is okay to invest at all time highs? The short answer is, yes, if you are investing and not short-term trading. If you prescribe to the notion of never investing at a new market high, it would have been very difficult to put money to work in 2023 when the S&P 500 notched 52 new all time highs that year. Likely, you would have waited for the “fall” which never came. You would have you left a 25% return on the table, but not investing in the S&P 500 for that year!
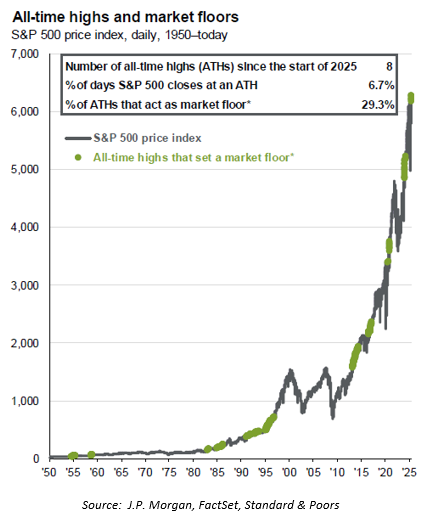
J.P. Morgan shows this information in a different way in two charts. The first looks at all-time highs and those that then create new market floors (the green price line when the market never falls more than 5% from the high). For about one-third of the time a new high is simply the beginning of new market floor.
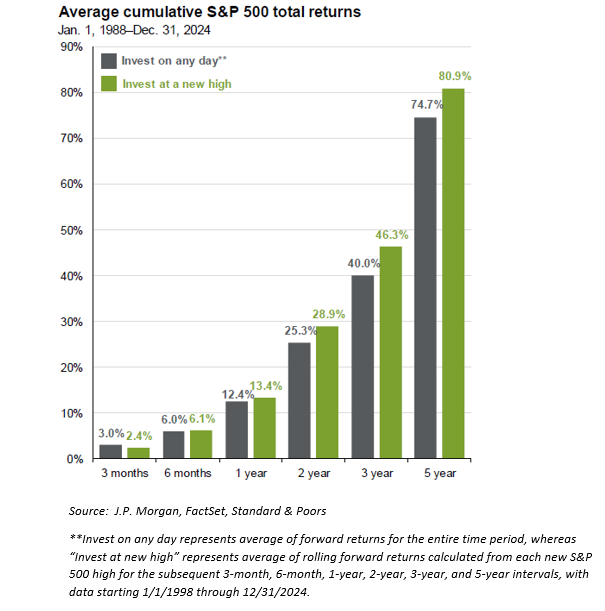
Put another way in second J.P. Morgan chart below, the firm calculated what the cumulative returns are for the S&P 500 if one invested on “any given day” versus invested at a “new high day.” The results are interesting and remind us of the importance of time in the market versus trying to trade in/out and think we can predict a bottom.
We could see more market volatility in the back half of the year due to tariffs, the Fed, corporate earnings, and economic slowdown. Risks are always present when investing in growth assets, but maintaining a level head, a diversified approach, and a long time frame is usually a recipe for success that we adhere to.
As always, please reach out to us if you have any questions.