
Sandy Cove Advisor's 2025 Market Review and 2026 Outlook
Sandy Cove Advisor’s Market Review & Outlook:
Happy New Year to you all. This is our second year combining our two lengthy pieces into one concise report covering both the investment year in review and discussing our outlook for the year to come. More bullet point summaries along with graphics and tables to illustrate our thoughts and work. There was a lot to unpack in 2025, and I am sure you are interested in how we are positioning for the next 12 months, so let’s get to it!
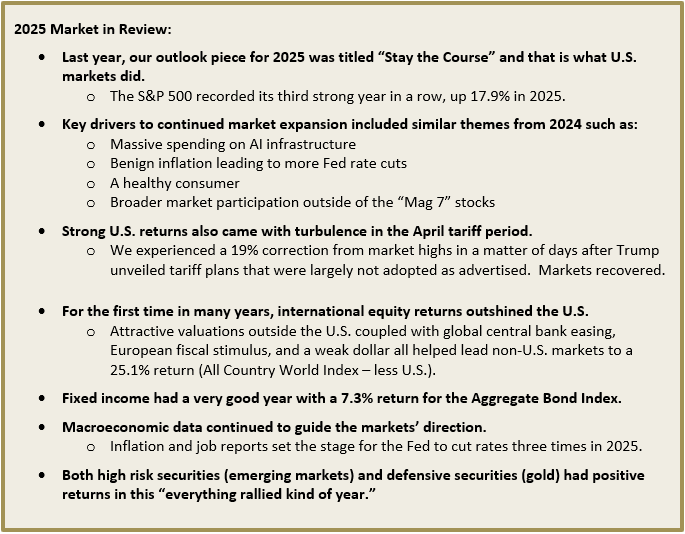
YEAR IN REVIEW: Year 2025 brought above average returns around the globe in both stock and bond markets as economic growth held up well despite uncertainties around tariffs and other geopolitical conflicts. Many economists initially lowered growth expectations after the April tariff announcments, but back-tracked when the reality was much less than was advertised. Additionally, improved growth in Europe and China helped lift many economies that has been stagnating prior to 2025.
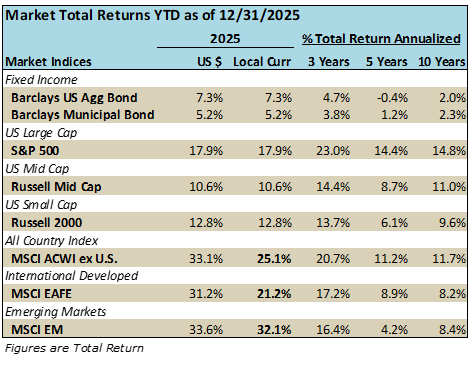
It was the first time in years that international stocks posted better positive returns than the U.S. Not since 2017 has the broad international index (MSCI EAFE) positively outperformed the S&P 500 (see table below).
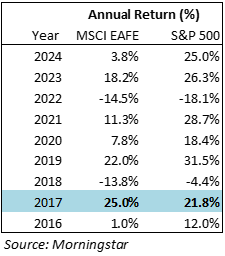
In U.S. dollar terms, the outperformance was even larger than local currency terms, as the U.S. dollar remained weak during 2025, and fell by 7% against other currencies during the year. The MSCI EAFE Index (developed non-U.S. countries) in local currency grew 25.1% last year and was up over 33.0% in U.S. dollar terms versus the S&P’s 17.9% rise (see bolded figures below).
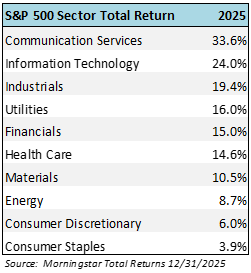
Year 2025 brought more diversified returns as multiple sectors posted double digit gains. While the strongest area continued to be technology (communication services up 33.6% and information technology up 24.0%), other sectors like industrials, utilities, financials, health care, and materials all enjoyed gains over 10% during the year (see table below).
Bonds had a very good year on the heels of moderating inflation, Fed interest rate cuts (3x in 2025), and a strong economic backdrop. Bond returns came from a combination of both income (the coupon payment on the bond) and an increase in price (as yields fall, bond prices rise). Bonds truly were a ballast in the portfolio for clients in 2025.
Government, corporate and municipal bonds all benefited from the positive macro environment in the U.S. The Barclays Aggregate Bond Index returned 7.3%, its best year since the 8.7% return in 2019. These returns were more equity-like, but the bond market is still coming out of the sharp -13% total return decline in bear market of 2022.
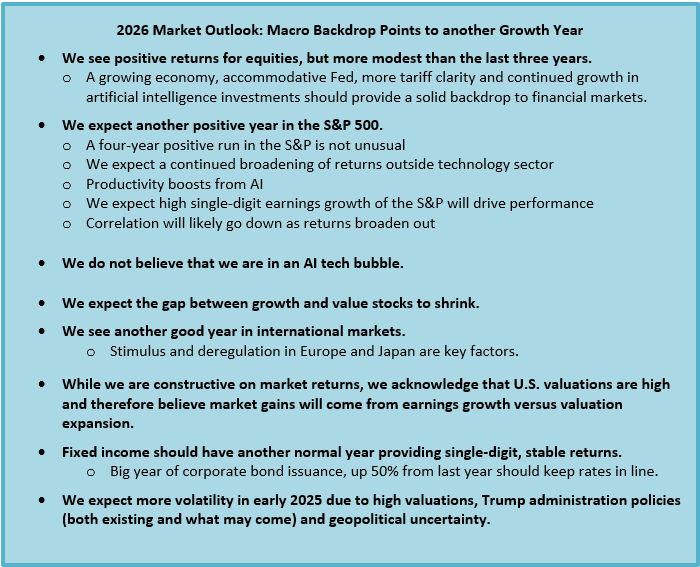
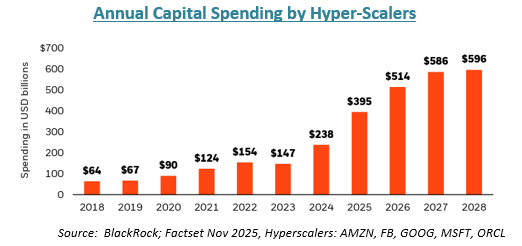
We are once again constructive on equities. The AI-related capital spending and investment mega-cycle has been the top driver of growth over the last two years, and we think that remains the case in 2026 as well. We expect infrastructure spending will continue to growth over the next few years as hyper-scalers have already offered up their forecasts (see chart below).
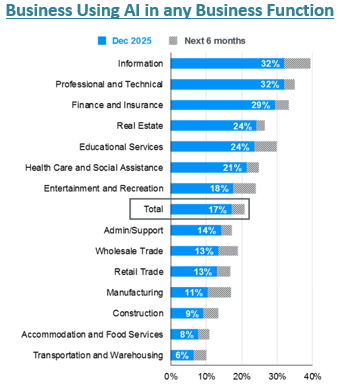
We have seen great market value creation in the building blocks of AI thus far, but we have yet to see the impact that using AI will have on the economy as its uses permeate all sectors and levels of business, education, health care, etc. The GDP benefit is still coming, and the productivity gains should be disinflationary.
We highlight a chart by J.P. Morgan showing what portion of business sectors are using AI today and will likely use it in the next six months. JP Morgan estimates that AI penetration is low at just 17%.
We expect other positive factors like economic stimulus and potentially lower interest rates to help keep markets growing as well. Valuations are at high levels (the price to earnings ratio of the S&P is 22.0x versus 17.0x historically). Thus, we believe corporate earnings need to be the key driver market expansion this year.
We also expect more volatility given market valuations. Unexpected events could create gyrations during the year, much like the tariff announcement did in 2025.
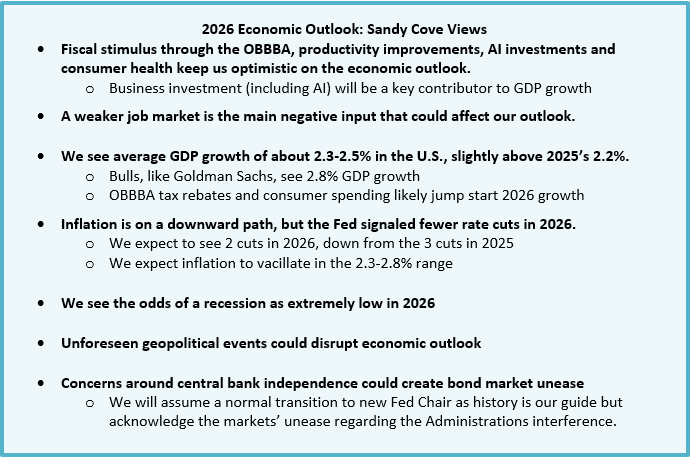
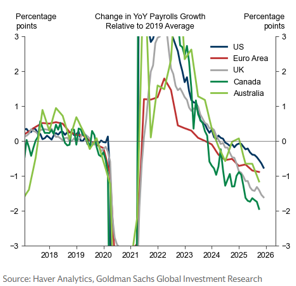
We do see a soft spot in the economy and that is in the labor market where payroll growth has decelerated in the U.S. and abroad post the COVID recovery. A slowing job market is still growing, but we will be keeping an eye on the monthly employment figures given the importance new jobs have on consumers and the economy. It will also be interesting if we can quantify AI-related headcount reductions.

We are re-sharing a table many of our clients are familiar with and we used in last year’s outlook piece. We think it is important to understand that bull markets do not abide by the calendar and turn on or off as we flip month-to month. Below is the NYU chart showing the S&P 500 historical returns by year.

The color-coded S&P 500 return view above is interesting on several levels:
- Since the depression, there were 6 times periods where the S&P had double-digits returns for 3 (or more) consecutive years.
- Uptrends tend to happen over multiple years as themes and events play out.
- The graphic also shows that it is not normal for the index to return to an average of 6-8% annual growth. Rather, the S&P 500 tends to have big up years and a few down years.
- In the last 2 decades, four years have had single digit performance (positive & negative) while the other 80% of the time returns were +/-10% or more.
We repost this graphic because we are often asked, how can the market keep going up after a few years of strong growth? Well, it can and it has. When a mega-trend like global disinflation or a mega-cycle like artificial intelligence is occurring, we tend to have multiple years where these favorable conditions effect stock markets. We still believe we are in the beginning stages of a transformative technology that can benefit our lives across multiple disciplines and we want our clients to reap those investment benefits.
What is keeping us up at night? Besides the Patriots in the playoffs, we have normal angst about the markets and what could go wrong. This year, we are surprised at how many economists/strategist have the same, favorable view of global markets in 2026. There is usually a bell-shaped type of curve of opinions, but we cannot find many negative outliers.
In conclusion, we are excited to embark on another year of investing for our clients. We hope the outlines, summaries, and graphics in this piece give you a good idea of where the markets have been and hopefully where they are headed. We look forward to speaking with you in this new year that we hope it is both healthy and prosperous.
As always, please reach out to us if you have any questions. And….GO PATS!