
January Market Update: A Choppy Start
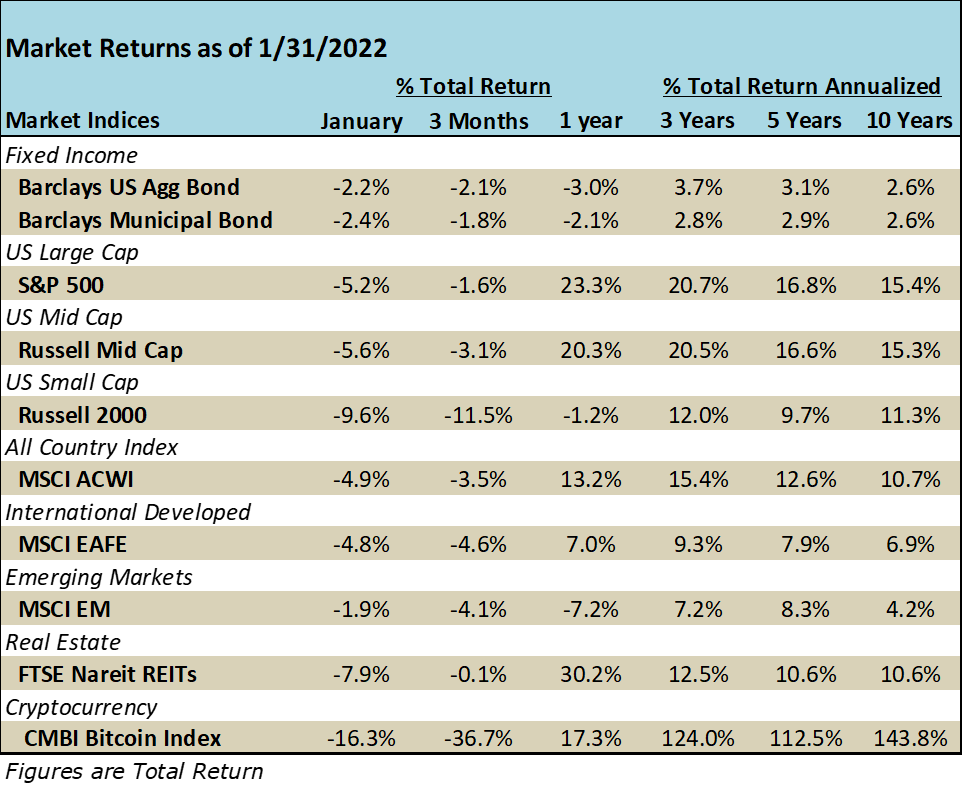

JANUARY EQUITY MARKETS
The major indexes suffered from a steep sell-off throughout January, bringing both the NASDAQ and the Russell 2000 into correction territory at one point during the month. January began with optimism as Apple reached a historic $3 trillion market capitalization. Shortly after, a series of market selloffs and large intraday reversals ensued, displaying the “choppy beginning to 2022” that experts telegraphed. In the face of market corrections, it is important to remember that these types of drawdowns are normal and usually come at a time when equities have had an outstanding run-up. The S&P 500 produced a total cumulative return of 100.4% in the three calendar years 2019 to 2021 with technology stocks largely leading the way. Thus, a sell-off from high levels is not unreasonable to expect. We wrote about this last week in our FLASH REPORT – JANUARY MARKET VOLATILITY, which is available on our website if you would like to read more on the topic. The biggest catalyst we can point to during the month was the market digesting the new hawkish shift of the Federal Reserve.
Once again, the energy sector started the year on a tear. Crude oil prices jumped from $77 to $88 per barrel propelling stocks like Exxon Mobil, which jumped over 25% in January alone. Financials maintained value as the prospect of higher interest rates suggests higher revenues for banks. Both the energy and financial sectors have a 0.6 correlation to treasury yields (a greater correlation than any other sector).[1] On the downside was the technology sector, falling -6.9% within the S&P 500 (still up over 26% on a one-year basis total return). We have noted previously that many tech companies are valued on future cash flows using a discount, or interest rate. As the discount rate rises, the value of the cash flows falls, thereby lowering the overall value of high growth companies. The steep rise in the 10- year treasury yield in January was likely the catalyst needed to bring high valuation growth tech stocks back down a bit. The tech-heavy NASDAQ index rallied at the end of January and that trend looked to continue into early February until Meta Platforms (FB) suffered a 25% price drop as they missed on earnings. Facebook (FB) stock is the fourth largest holding in both the S&P 500 and the NASDAQ index.

International indexes joined in the January drawdown as well but did not suffer as greatly as U.S. equities. The European Central Bank (ECB) continues to taper bond purchases until the end of 2022 and under that plan, will not likely raise interest rates until at least next year given Europe’s inflation figures are projected to fall below 2% in the medium and long term. The ECB’s policy is in stark contrast to the actions of the Bank of England and the Federal Reserve, and some market participants are factoring an ECB shift to the more aggressive side.[2]

JANUARY BOND MARKETS
Bonds took on heavy losses and yield climbed sharply in January as the Fed conveyed a potentially aggressive pullback in stimulus. While baseline schedules call for three, quarter-percent rate hikes in 2022, some parts of the market are pricing in up to five rate hikes and a possible half-percent hike. The 10-year yield rose from 1.52% at year end to 1.79% and the spread on the 10-yr and 2-yr tightened from 79bps to 61bps. The implications of these changes mean that the market is expecting higher rates in the future (for a variety of reasons). The Aggregate Index return (bell weather bond index) of -2.1% was the worst one month decline since November 2016. Corporates fared worse, partially due to the longer duration in that sector (rising rates hurt longer-dated bonds more than shorter-dated ones).
Even munis could not hide from the drawdowns. The municipal bond market recorded its worst January performance on record. The sharp selloff in tax-exempt mutual funds continued to the final week of the month, when investors took out $1.4 billion, the most since the early pandemic lockdown. Credit quality is good for municipal bonds and the rise in government investment as well as a strong economic recovery over the last year has supported prices in 2021. Until recently, these bonds have had relative richness due to this heightened credit quality and the expectation that rising tax rates would make tax exempt bonds more attractive to a larger part of the population.
JANUARY ECONOMIC PULSE
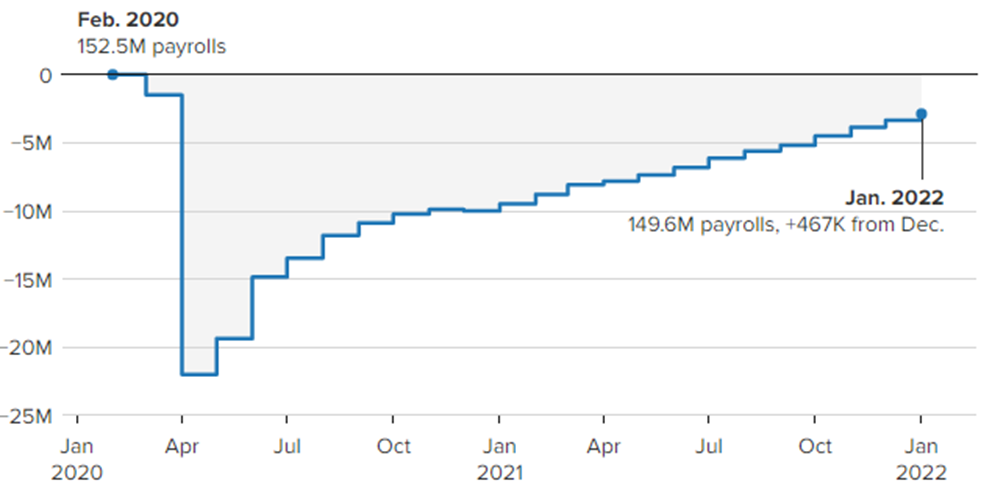
Job growth in December initially looked disappointing at 199K in job gains versus expectations of over 450K. However, on Friday, February 4th the Bureau of Labor released January figures and revised December figures. Both were large surprises to the upside. December payrolls were revised from 199K new jobs to 510K new jobs! In January, jobs gains also surprised and grew by 467K new jobs (economist were looking for job losses in January due to Omicron). The private sector accounted for 444K of those jobs. Interesting growth occurred in leisure and entertainment jobs in January which saw 151K new hires in the face of the Omicron surge. Wage growth continued to move higher with a 5.7% gain year-over-year (still lags 7.0% inflation). Another piece of good news in the report was the labor participation rate which rose to 62.2%, the highest rate since March 2020 and only 1.2% points away from pre-pandemic levels. Unemployment dipped by a tenth to 4.0%. While the news was good, the data was being questioned by the Bureau of Labor Statistics because the December revision was so extreme. The January jobs report likely provided the Fed with more data to hike rates. As such, the bond market reacted on the jobs report sending the 10-year treasury yield to 1.93%, it’s highest level since November 2019.


Demand for jobs which remains high, which is a positive indicator for future economic growth. The issue has been a lack supply, i.e. workers (the great resignation).

To entice workers back into the workforce, companies have sweetened the package with better wages and benefits. However, the average hourly wage increase from last year is more than eaten up by the 7.0% CPI inflation. The Fed has little choice but to begin monetary tightening, in our opinion. It will be debated for months and not known for many more, if the Fed’s path (timing and amount) is the right recipe to bring inflation down to normal levels.
As discussed in previous articles, inflation is at multi-decade highs, and the stickiness of those heightened levels may be determined by the supply and demand of goods as well as labor. The headline CPI inflation gauge was up 7% year over year, driven up by a complex combination of structural supply chain issues, shortage of goods and inputs, and a shortage of labor.
Other important economic data points for the month are highlighted below:
- GDP – annualized 4th quarter growth was 6.9%
- CPI – grew 0.5% In December and 7.0% year-over-year, the fastest pace in 4 decades
- Core CPI – all items excluding food and energy were up 0.6% versus November and 5.5% y-o-y
- Personal Income – rose 0.3% in December
- PCE – Fed’s favorite inflation gauge, rose to 5.8% yoy and 4.9% excluding food/energy
- Retail Sales – dropped -1.9% in December and consumer spending overall declined -0.6%
- Durable Goods Orders – slipped in December down 0.9%
- US Leading Economic Indicators – the Conference Board LEI continues to increase, up 0.8%
- ISM Manufacturing Index – still in expansion, at 58.8 in December
- Housing Starts – rose to 1.873 million, a big positive surprise
We believe several economic data points above were negatively affected by behavioral changes to the new Omicron variant. This may bleed into January data points released in February as well, but we still see strong pent-up consumer demand and historic high savings rates as positive catalysts for GDP growth in 2022, it just may not be apparent in the first quarter. The charts below highlight how consumer sentiment has waned in the last few months of 2021, but the overall level of income and savings is likely to feed into GDP growth over the longer term.


JANUARY GOVERNMENT ACTION
The big news was at the Federal Reserve this month where Jerome Powell “refused to rule out the possibility of larger-increment hikes.” Markets took this to mean that the likelihood of more aggressive rate hikes is likely.
Talk of the Build Back Better plan seems to be sidelined as the government shifts focus to Russian/Ukrainian tensions. There is growing consensus in Washington that any bill resembling Build Back Better will be greatly slimmed down from its original version.
COVID-19 UPDATE
The sharp peak in cases caused by the Omicron variant has seemed to subside according to the 7-day rolling average that that CDC reports on. While we hope that the latest wave of infections has burned out, we are cautious in expectation of the government’s rollout of free at-home testing kits. It is quite possible that as the government ships out the free tests to each household, the CDC may no longer receive notice of many positive cases.

ON TO FEBRUARY
For the next several weeks, the market will digest corporate earnings and economic data that may solidify the Fed’s thinking on fiscal tightening. Since the market lows of late January, we have seen a few strong rallies, but typically a correction is a process, not just straight down and straight back up. Thus, we think we need to get comfortable feeling a little uncomfortable about volatility. Try not to focus on day-to-day price actions. If the markets continue to cause you angst, please reach out to have a conversation with us.