
First Quarter Market Update: Inflation and Invasion

FIRST QUARTER EQUITY MARKETS
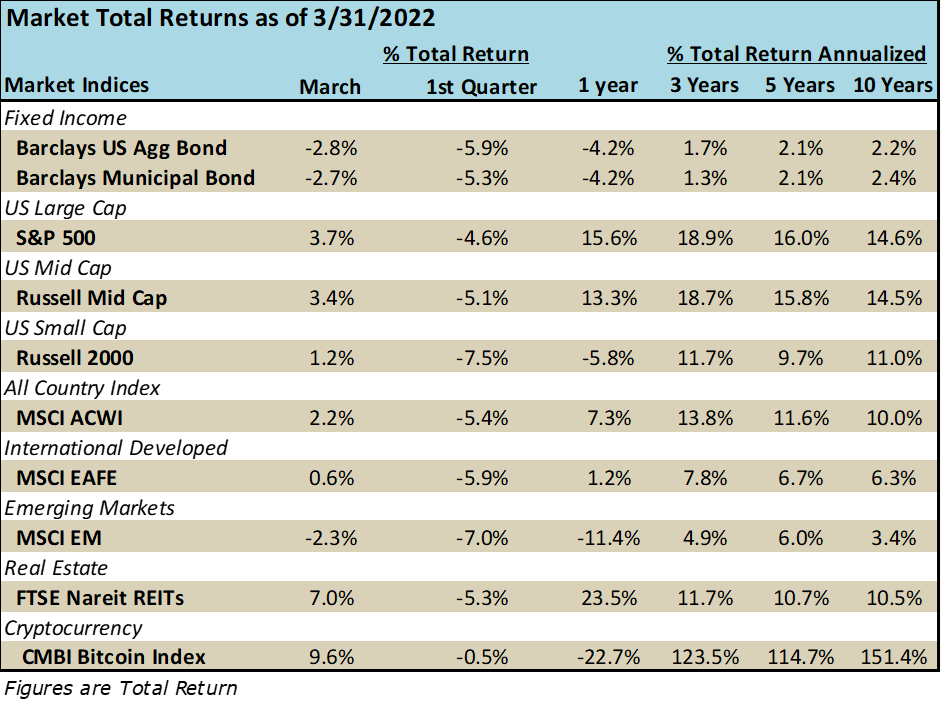
Stocks fell early in the quarter even before we received the news of the Ukraine invasion. Major indexes across the globe fell into correction territory on worries of inflation and geopolitical aggression. As with most large down days in the market, they were quickly followed by large up days. On one such day, the tech-heavy NASDAQ index saw a 7.0% swing in value, first falling 3.5% before recovering and finishing the day up 3.5%! After a difficult January and February, equity markets rebounded from what many perceived were oversold situations. The S&P finished the quarter down -4.6% and a similar amount from its all-time high printed on January 3rd of this year. The chart below shows a six-month path of the CBOE Volatility Index (VIX), which rises with uncertainty.
Six Month CBOE Volatility Index (VIX)

Source: CNBC, CBOE
Short-term volatility will likely remain due to the unknown’s surrounding inflation and the continued war in Ukraine. From a sector perspective, all sectors posted negative quarterly results except for the energy complex, which posted a strong 39% gain. The cyclical and defensive sectors like industrials and healthcare were down only modestly compared to the declines in secular growth sectors like technology and consumer discretionary.

Inflation is still a big concern, and while the bond market seems to have factored in a more aggressive Fed path to tightening interest rates, we don’t think the equity markets have accepted this new potential reality. At quarter’s end, the S&P 500 was off only 4.6% from its all-time high.
FEDERAL RESERVE
We devote some time in this quarter’s write up to the Fed because we are at the beginning of a monetary tightening cycle. The Fed raised rates 0.25% for the first time in about three years. The Fed also raised its year-end expectation for inflation to 4.3% (still well above their 2.0-2.5% target) and lowered their GDP expectations.
Can the Fed orchestrate a soft landing? Can they raise rates just enough to slow growth and reduce inflation without moving the economy into a recession? We have noticed a much more hawkish tone from all Fed governors after the March meeting as they try to communicate to the markets that they need to take action to combat inflation. Chairman Powell noted a 50-basis point hike is now on the table and could be implemented as early as the next meeting May 3-4th. In addition, the FOMC minutes from the meeting were released signaling a balance sheet reduction pace of about $95 billion per month. This is another measure of quantitative tightening in addition to rate hikes. All these signals contributed to a big move in yields at the end of the quarter.
FIRST QUARTER BOND MARKETS
The bond market selloff we started to see early in the year intensified in March as inflation gauges signaled progressive increases and the likelihood of a hawkish Federal Reserve became more of a reality. News of Putin’s invasion of Ukraine in late February briefly halted the selling pressure, but the realization that the invasion would mean higher energy prices kept the pressure on the bond market. As the quarter ended, the benchmark bond index (Barclays Aggregate) underperformed equities (S&P 500), both in negative territory. March 2022 bond returns were the worst for the bond index since July 2003.
As the market began to realize that the Fed would likely have to do more rate hikes than were expected, the short end of the curve rose dramatically as noted in the 2-year treasury yield chart below.
U.S. 2 Year Treasury Yield

The long-term yield did not rise as much creating a flatter yield curve.
U.S. Treasury Yield Curve (2 timeframes)

Source: JP Morgan Guide to the Markets, 3/31/22
What the bond market is telling us is that the Fed’s actions are too late and behind the curve and they will have to move quicker. This in turn, increases the risk of a recession since the Fed cannot be as measured in its response as it would like and time is not on their side.
The longer the bond is to maturity, the worse it’s price decline when rates rise. This is illustrated in the Bloomberg municipal bond indexes of various durations below. A 3-year bond fell -1.7% in March versus a 15-year bond which suffered a decline of -3.8%.

Source: Bloomberg
March is typically a weak month for municipals, so we could see more dislocations in the near-term. It was good to see that the during the initial Ukraine invasion, the municipal bond market was incredibly stable. We also remind municipal bond investors that during the previous two Fed rate hike cycles, municipals have outperformed other high quality fixed income assets.
MORTGAGE RATES
The refinance boom allowed many homeowners to reduce their debt cost on their homes for the past few years. This wave of refinancing has likely come to a halt as mortgage rates have spiked back up to 2019 levels. The chart below shows the path of the 30-year fixed mortgage rate from Dec 2018 through March 2022. In the first week of April, the 30-year rate has exceeded 5%.

Source: COMPOUND
SANDY COVE ADVISOR ASSET ALLOCATION SHIFTS
During the first quarter, Sandy Cove Advisors made two tactical allocation shifts. These changes were designed to protect portfolios from what we believe will be challenging markets in both international equities and fixed income.
LOWER INTERNATIONAL EQUITY WEIGHT
Our first change was to reduce our international equity weighting due to the uncertainties of war in Ukraine and a cloudier outlook for European economies. We are lowering our international equity exposure and using the proceeds to increase our inflation shield position and keep more cash on the sidelines than usual. We view these changes as a near-term tactical shift that will create more defensive portfolios over the (coming months – may be shorter) next 12+ months. After strong market returns in equities over the last three years, we think it is prudent to make these adjustments. War, higher energy prices, and inflation pressures occurring all together will make for more volatility and uncertainty in the near-term.
LOWER DURATION IN BOND PORTOLIO
The second change we made in our client portfolios was an adjustment in fixed income. The inflation picture seems to only be getting worse and we expect the March CPI to show about an 8.5% year-over-year increase. The Federal Reserve has a challenging task to reign in rising costs and we expect the yield curve across all durations to rise. Longer dated bonds will suffer a bigger price decline than short-term ones. Until we have better data points on the Fed’s ability to lower inflation, we think it’s best to keep clients’ portfolios invested in the ultra-short and short-term end of the bond market. We sold out of the intermediate bond allocation of client portfolios (about 25-30% of total) and moved into ultra-short and short-term bonds. This lowered the average duration from about 5 years to a little less than 2 years. Bond duration is a good indicator of how sensitive a bond's price is to interest rate changes. For example, if rates were to rise 1%, a bond or bond fund with a 5-year average duration would likely lose approximately 5% of its value. A bond with a 10-year average duration would likely lose 10% of its value with the same 1% rate increase. By shortening duration, we are aiming to further protect client portfolios from the uncertain paths of inflation and Federal Reserve actions.
FIRST QUARTER ECONOMIC PULSE
The good news on the economy is the strong string of new job growth reports in the U.S. in the past three months. Overall, the first quarter averaged over 560,000 of new jobs per month. The labor market is extremely tight and the unemployment rate of 3.6% is at a 50-year low. We are also seeing wage growth and an increase in average hours worked as the economy is demanding more workers to produce more goods and services.

The Federal Reserve will be raising rates from an economic position of strength. And continuing to raise rates is necessary given the inflation that we have witnessed. As the chart below shows, both the Core CPI and Core PCE (“core” excludes food and energy) are well above the Fed’s long-term 2.0% goals. It’s time to remove liquidity from the economy where there are now too many dollars chasing too few goods.

Source: BLS, Natixis
Some of the inflation brought about by supply-side disruptions should abate during the year and we see should see evidence of this as the port traffic begins to normalize (see chart below).
Los Angeles Port Traffic
(days at anchor/berth, shown with 10 day average)

Source: Longview Economics, Macrobond
While inflation is at its highest level in nearly 39 years, it did not deter consumers from spending aggressively! February’s core personal consumption expenditures (PCE) price index rose 5.2% from a year ago. As a reminder this is the Fed’s preferred gauge of inflation. Including food and energy prices, the PCE grew 6.1%, the strongest gain since 1982. The consumer is still purchasing, and higher prices have not altered many buying patterns at this stage. Another statistic reaffirms this view: Retail sales rose 3.8% in January and 0.3% in February.
Other important economic data points for the month are highlighted below:
CPI – grew 7.9% in February, with core up 6.0%
PPI – rose 0.8% in February
PCE – Fed’s favorite inflation gauge, rose to 6.4% in February, its highest level since 1983
Retail Sales – rose 3.8% in January and 0.3% in February, rebounding from a December decline
Consumer Confidence – is still high given the Ukraine invasion with the index at 107.2 in March
US Leading Economic Indicators – the Conference Board LEI continues to increase, up 0.3% in February
PMI Service – grew for 22nd month in a row expanding to 58.3% in March
PMI Manufacturing – also 22nd month of growth to a reading of 57.1% in March
Housing Starts – surges in February up 6.8% to a seasonally adjusted annual rate of 1.769 million homes in February
The U.S. consumer has a high savings level, is mostly employed, and has strong demand to purchase goods and services. Demand is clearly not the issue with the U.S. economy, it’s the supply. While some disruptions may ease, higher prices from commodity and energy inputs are likely here to stay. How that may affect consumer confidence and spending in the future remains to be seen, but it’s something we are keeping a close eye on.
ON TO SECOND QUARTER
For the next several months, we will no doubt see and hear about the continuing tragedies in Ukraine. Financial markets will be taking their cue from not only the Federal Reserve in the near-term, but also from the geopolitical events and what those economic and financial impacts might be. Market volatility (both big up and down days) will likely continue.
History does provide us with some guidance in terms of how markets react, how far they fall, and how long it takes to recover. We provide you with the table below of historical geopolitical events and stock market reactions.

Source: LPL Research, S&P Dow Jones Indices, CFRA 1/6/20
As a reminder, volatility in equity markets is normal. It usually comes about due to a negative event or perceived threat to economic growth. Many of our clients have seen a chart like the one below that we use to remind ourselves that the last three-year, cumulative 100%+ return of the S&P 500 is not normal. Market ups and downs are normal, but 75% of the time, markets end with a positive return.

Source: JP Morgan Private Bank
Historically, buying the S&P 500 down 10% from a recent high has rewarded the buyer a double-digit positive return over the next 12 months.
The sell-off in equities in the first quarter is the largest since the beginning of the pandemic in 2020. Markets recovered a bit in March, but still ended the quarter negative. Given the geo-political events and the fight being waged by the Fed on inflation, we expect volatility to continue during 2022 until we see some resolution on both macro events. While sometimes unnerving, the near-term volatility and price reduction ultimately creates long-term opportunities.
Again, we are in unchartered territory, and it is normal to feel a bit of unease about the financial markets. Sandy Cove Advisors has sent out two FLASH REPORTs in as many months to assuage fears, but have also been connecting with clients who may still feel uneasy. If you would like to have further discussions with our team, one-on-one, please do not hesitate to contact us.
Lastly, our thoughts and prayers are with the Ukrainian people at this time. Sandy Cove Advisors has made a donation to the World Central Kitchen to aid in their valiant efforts to feed Ukrainians uprooted from their homes and fleeing to safer locations.