
2022 Market Outlook: Year of Fiscal Tightening

We titled our outlook piece with a focus on the Federal Reserve because we believe this government body holds more control over the path of the economy and therefore markets, than possibly any other entity or event this year. Can the Fed correctly time the level and amount of interest rate hikes that will reduce inflation back to normal levels, but not negatively affect economic growth? That is the trillion-dollar question for 2022: can the Fed stick the landing?
The Fed’s dual mandate of maximum employment and stable prices is only half filled as we turn the calendar to 2022. Employment has come back dramatically as we reopened the economy, but pricing has surged. With inflation (core PCE, the Fed’s preferred measure) at 4.7%, it is well above the Fed’s preferred long-run rate of 2.0%1. Let’s take a closer look at the economic picture and its components which guide us to our expectations of single-digit equity returns and flat/slightly negative fixed income returns for 2022.
Economic Picture
We see the path of the U.S. economy as one of continuing recovery, but the biggest gains are likely behind it. Tougher year-over-year comparisons combined with lack of stimulus and Fed hikes will make 2022 a lower growth GDP year. Our survey of economists and strategist show a wide range of expected outcomes, but all are below levels obtained in 2021. GDP growth for the U.S. is expected to be between 2.5%-4.0% compared to 2021’s likely full year GPD of 5.5%-6.0%. The path of recovery from COVID-19 is the main factor for the wide range of GDP forecasts for 2022. Globally, growth will also slow, and the IMF expects 4.9% global GDP in 2022, down from its 2021 expected 6.0% level. As with 2021, we expect a slow first quarter as COVID cases again spike and deter travel and leisure segments of the economy. High frequency economic activity is already showing lower hotel occupancy, TSA traffic and dinner reservations in Dec/Jan timeframe. Then we see growth accelerating for the rest of year thanks to a continued recovery around the globe, access to vaccines, and better herd immunity.
Key Economic Stats in the U.S.
- Leading economic indicators rose sharply in November to 119.9
- Personal income increased 0.4% in November while consumer spending rose 0.6%
- Existing home sales continue to rebound in 2021 hitting annual rate of 6.5 million
- The median home price rose nearly 14% from 20203
- Manufacturing production has stayed well above 50 all of 2021, indicating continued expansion
- Labor market continued to heal with unemployment rate down to 4.2% in November
- Jobless claims continued to fall in 2021 (see chart below) and are now sub-200K level.

Labor force participation has been meager and after so many months of assuming it would snap back to pre-COVID-19 levels, most strategists are inclined to acknowledge the “great resignation” is a structural problem that is part of our economic future. According to the Bureau of Labor Statistics, 4.5 million workers quit their jobs in November 2021, a new monthly record.
Failure to pass the Build Back Better bill in 2022 will further impact the year-over-year decline in fiscal support between 2021 and 2022. In short, the liquidity party that the U.S. government created to combat COVID is over. No more forgivable loans, extra unemployment benefits, increase child tax credits, etc. at this point.
Inflation & the Federal Reserve:
There is trepidation the Fed will find the perfect calculation of rate hikes that lower inflation and keep the economy growing. It was just last year when the Fed misinterpreted the pace and level of inflation. We heard, ad nauseum, how inflation was “transitory” only to see prices continue to rise month over month. By November, Fed Chair Jay Powell admitted that he no longer can use the word transitory. As you recall, Sandy Cove Advisors was not in the Fed’s camp regarding price increases, and we added inflation protected investments into portfolios mid-year. Our clients benefited from these moves.
As you can see from the chart below, the run up in inflation at current levels is something we have not seen since 1982!
Consumer Price Index (CPI), % change y-o-y
Inflation is such an important factor in our lives, and it’s why it is one of only two mandates that the Federal Reserve is focused on. Inflation eats away at purchasing power; our dollars don’t go as far as they once did. We have probably all experienced how much more we’ve paid this year to fill up the gas tank than last year. Inflation is a key component in our financial planning process as well. Long-term planning incorporates expenses and inflation-adjusts them annually. Living longer lives means making sure that your sources of cash (asset returns and income) for expenses can keep up with increasing cost of living. We are witnessing above trend inflation in 2022 just as we expect to see much lower equity returns for the next 10 years. We’ve enjoyed a decade of economic expansion and bull markets resulting in a historical 10-year annualized return of the S&P 500 of 16.6%, but our 10-year forward outlook for U.S. large cap equities is much lower than that (closer to 7.0%) as we expect a reversion to the mean. Thus, the challenge of keeping up with inflation is a concern in the future and a key issue the Fed needs to address.
The Fed will likely end its bond purchases by March 2022 and signal that end at its March FOMC meeting. Most economists expect the Fed will initiate its first rate hike at the March or June FOMC meeting. This will be the first hike since December 2018 when the Fed increased the Fed Funds rate from 2.25% to 2.50%. To put the rate hikes in perspective, we offer this 20-year historical chart of Fed hikes. As you can see, our economy can and has tolerated rates much higher than our current near-zero metric today.
20 YEAR FEDERAL RESERVE RATE HISTORY (Dec 2001 – Dec 2021)

The market is currently discounting three rate hikes of 0.25% each from the Fed in 2022.
Corporate Earnings Growth
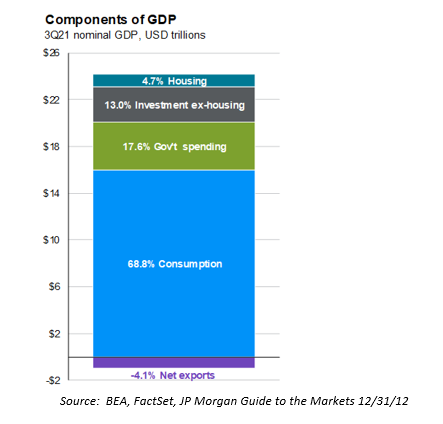
S&P 500 earnings are poised to moderate after hitting an all-time high in 2021. Earnings growth shrank considerably in 2020, with S&P 500 earnings growth down 22%, as we shut the global economy down due to COVID. With such easy comparisons and an economic reopening in 2021 we saw S&P 500 earnings bounce back, growing nearly 72%! So now we face difficult comparisons year-over-year for 2022 earnings growth. We expect earnings growth of about 8-10% in 2022, still a very healthy figure. Pent up demand and higher prices should drive revenue growth and we expect profit margins will expand slightly. The level of profit expansion will be determined, in part, by wage growth. The labor market is expected to be tight in 2022 with over 10.6 million jobs unfilled as of the November 2021 reading.2 If companies need to raise wages further to attract workers, our earnings growth assumptions could prove to be too robust. We will be watching wage growth closely. While a negative effect on profit margins, higher wages in the hands of consumers is positive for GDP as nearly 2/3rds of our gross domestic product is a function of American consumption of goods and services. The table below shows the last quarterly report of U.S. GDP and how it is broken down by category.
U.S. EQUITIES
We have just had three years in a row where the S&P 500 had double-digit total returns, well above the long-term average. We do not think we’ll see a fourth year in a row, unfortunately. With less stimulus, likely rate hikes, and tougher comparisons, we see the overall equity market up in the single digits for 2022. As mentioned, the outsized returns of recent history are not likely to repeat. Sandy Cove is using a 10-year annualized return for the S&P 500 in the 7.0% range, which is in line with major firms such as Goldman Sachs and BlackRock. Our forecast incorporates our thoughts on paying for the huge government debt we added to during COVID and returning to a normalized, mature GDP growth rate in the 2.0% range.

S&P 500 Price Chart 2011-2021

The macro environment is still supportive of equity markets. Wage growth, near full-employment, pent-up demand, and high savings will create a good environment for consumption growth. Corporate fundamentals should continue to improve the bottom line. All this bodes well for U.S. equity returns.
Despite our positive outlook, January may not start us out on a positive note for the year. We will likely see the highest daily cases of COVID-19 recorded since the beginning of the pandemic. This is certain to give the markets cause for a pause/decline. Additionally, market history from DataTrek Research shows us that after a strong calendar year of returns (like 2021), January tends to be subdued.
P/E Contraction?
With so much money moving into equities, valuations have moved higher. Indeed, we would characterize values as stretched, with the S&P 500 trading at 21.2x forward earnings.4 Slowing global liquidity is generally not good for price-to-earnings (P/E) multiples. Valuing a company’s future cash flows to determine a fair price for the stock produced higher valuations over the last two years because the discount rate used (interest rate) was significantly lower than any time in recent history. Thus, the market in 2020 and 2021 could justify higher P/E multiples on stock because rates were low. Now in 2022, we are facing the prospects of higher interest rates, and therefore, a higher discount rate on cash flows, which ultimately lowers the forecasted valuation of those cash flows. We should see some price/earnings contraction, especially for low-no earnings companies which rely only on the valuation of their future cash flows since they have little to none currently. Non-earners like early-stage companies, biotech firms, and certain technology companies may be challenged in 2022 without the benefit of current income and higher discount rates.
Volatility
We see a high probability for temporary market pullbacks in 2022 as investors adjust to higher rates, lower multiples, and are wary of the Fed’s success to “stick the landing.” We do see the market ultimately ending the year higher and eyeing single digit total returns (market appreciation plus dividends).
International Equities
International markets had a good double-digit year in 2021, but not nearly as strong as U.S. equity returns. International markets simply don’t have the strong technology brands that the U.S. enjoys and in times of technology advancements, like we’re in, the U.S. will likely continue to outperform other markets. Technology companies represent about one-third of the S&P 500 index, but only 14% of the All-Country World Index -ex U.S.
The U.S. benefited, in part, from strong returns of a narrow selection of the large cap technology market. Over 30% of the market capitalization of the S&P 500 is held in the top 10 of 512 companies in the Index and their returns were (mostly) well above the overall indexes return. Eight of these top 10 names are tech related.

That does not mean we should ignore the entire asset class. Valuations are quite attractive outside the U.S. markets and trade at a substantial discount. For example, Europe’s average price/earnings ratio is 15.6x, well below the S&P 500 at 21.2x.5 Additionally, the dividend yields of non-U.S. markets are higher on average (1.6% yield versus 1.2% for the S&P 500). With various technology valuations stretched after performing well in 2021, we could see other sectors begin to lead, which would benefit international stocks. Lastly, we have chosen active international managers for our allocation to international equities and those managers have done well over time. Over the last three-year period our main international investment strategies have an average total return of 13.5% per year versus the MCSI EAFE Index return of 9.6%. On a five-year time period, average total returns of our strategies were even better at 24.9% versus 18.7% for the MSCI EAFE benchmark.
FIXED INCOME:
We expect 2022 will be a challenging year for bonds as the Fed moves to a more hawkish stance. Higher interest rates are likely on tap, which negatively affect bond prices, depressing the overall total return for the asset class.
Ten-year U.S. Treasury yields peaked in 1981 at 15.8% and have been on a steady decline for two decades ending 2021 at 1.5% and greatly impacting the income generated from bond portfolios. An economic reopening combined with a Fed set to raise rates will likely change the path for government yields. However, coming from such a low yield level, the income produced may not be enough to offset the price declines. We expect government bond real returns will likely be negative all year as the modest nominal yields (10-Year treasury at 1.51% at 12/31/12) will be well-below CPI inflation of 4.96% resulting in a real yield of -3.45%.
10-YEAR TREASURY YIELD OVER PAST 20 YEARS (Dec 2001 – Dec 2021)

Spreads between risky (high yield) and safe (government bonds) are very narrow meaning you are buying riskier assets, but not being compensated in the yield (return) for that risk. Many bond market experts believe that high yield is currently priced for perfection and have been reducing or eliminating this category from their models. For the most part, we have avoided moving out the risk curve exposed to lower credit quality, preferring to move duration shorter to protect from rising rates.
Municipals bonds are still attractive versus corporate bonds or Treasuries for those in tax brackets of 32% and higher because the after-tax yields are higher. Additionally, municipalities benefitted from multiple stimulus packages during the pandemic and ended the year with much better balance sheets. Demand for municipal bonds continues to be high.
We have always viewed fixed income as the ballast in a portfolio. It provides diversification from equities and protection from equity market shocks and economic slumps. Sandy Cove Advisors continues to keep a shorter duration than the Bloomberg Aggregate Bond Index duration (6.6 years) to position clients better for an expected steepening of the yield curve (the longer the duration, the more sensitive to interest rate increases). In addition, we added an inflation hedge investment strategy to portfolios in 2021 which includes TIPS (Treasury Inflation Protected Securities). We would look to add duration and improve yields when we believe the Fed is done tightening.
Forecast Caveats:
What could prove our forecasts wrong for 2022? There are certainly factors that could affect and/or change our market assumptions for 2022. We list our top four reasons for better or worse conditions than we’ve laid out in this piece, with the biggest factors being the Federal Reserve and COVID-19, in our opinion.

We look to 2022 with guarded optimism. We are still dealing with the negative effects of COVID, but collectively, we are better prepared and educated to deal with it. We see continued global growth occurring in 2022 but are not certain what path inflation will take to potentially impact that growth. Lastly, we hope that the Fed can find that Goldilocks balance of bringing inflation back down while still creating an environment for capital investment and profit growth.
There are plenty of other unknown risks in the world, and the best protection is to diversify and plan. We continue to pay attention to our clients’ diversification through asset allocation and investment strategy selection. We expect more muted returns in equities for next few years and think inflation levels could impact future expense expectations. Markets don’t always go up double-digits, so it is prudent to have financial plan check-ups to ensure goals are being met.
As always, your Sandy Cove team is available to answer any questions about the markets or your portfolio. We wish you all a happy and health new year.
If you like to take a look at the year 2021 in review, please read our blog, 2021 Market in Review: Year of the Vaccine